Role: user
The WEPP Model
Model Background
The WEPP model is a physically-based hydrology and erosion model (Flanagan and Nearing, 1995; Flanagan et al., 2007), initially developed to be applied at hillslope scales or in small agricultural catchments. The advantage of WEPP is its ability to estimate the spatial and temporal distribution of soil loss or deposition along a hillslope, as well as sediment yield at the bottom of a hillslope. WEPP is based on the fundamentals of hydrology, plant science, hydraulics, and erosion mechanics (Flanagan and Nearing, 1995). For detailed descriptions of model components and processes, refer to the WEPP User Summary (Flanagan and Livingston, 1995) and WEPP Technical Documentation (Flanagan and Nearing, 1995).
Developments such as the incorporation of baseflow algorithms and channel routing methods have extended the applicability of the model to larger watersheds. The model has been tested for several undisturbed watersheds and for forest management effects on water and sediment yield from watersheds in the Pacific Northwest (Brooks et al., 2016; Srivastava et al., 2020).
The following is a brief description of model components and processes.
Watershed Delineation
Watershed delineation is the set of topographic analysis and processing steps used to turn a digital elevation model (DEM) into a hydrologically connected watershed representation. The process includes:
- Correcting the DEM so water drains downhill by filling or breaching depressions.
- Deriving flow accumulation and using user-defined settings to identify the channel network.
- Defining the watershed boundary.
- Dividing the area into hillslopes within that boundary.
- Determining how each hillslope drains to the channel network.
Watershed delineation can be performed by TOPAZ or WEPPcloud-WBT.
TOPAZ
- Topographic Parameterization (TOPAZ) is used to derive topographic features (slope length, width, aspect, slopes) from the Digital Elevation Model (DEM).
- TOPAZ characterizes watersheds as representative hillslopes and channels, and links hillslopes to channel networks.
- Fill hydroenforcement only.
- Legacy, unmaintained fixed Fortran source code.
- Output grids and tables from TOPAZ are included in archived project downloads. Descriptions of these products are available in the TOPAZ Manual.
WEPPcloud-WBT
- WEPPcloud-WBT is a WEPPcloud-maintained fork of WhiteboxTools used operationally for watershed preprocessing and delineation.
- It provides modern DEM-based hydrologic preprocessing (for example D8 flow direction, flow accumulation, and stream extraction) and is designed for larger catchments and high-performance raster workflows.
- Fill and breach hydroenforcement, including road-aware embankment breaching.
- Supports DEMs with
nodatavalues. - Actively maintained as part of the WEPPcloud stack.
- The
HillslopesTopaztool implements Garbrecht and Martz TOPAZ-style stream and hillslope identifiers for a single watershed and emits WEPPcloud-ready channel metadata tables (netw.tsv,netw_props.tsv) plus left/right/top hillslope rasters. - The
FindOutlettool derives a stream outlet pour point by tracing D8 flow and supports requested start locations for interactive outlet selection. - The
StreamJunctionIdentifierandPruneStrahlerStreamOrdertools support confluence/junction analysis and stream-order pruning workflows used by WEPPcloud modules.
Watershed Abstraction
WEPP represents hillslopes as rectangular elements with a width, a length, and a slope profile. Watershed abstraction is the process of converting delineated topographic data into those WEPP-ready hillslopes and channels. The process includes:
- Using the delineated watershed to identify the cells that belong to each hillslope and channel.
- Walking downslope flowpaths to measure how slope changes with distance to the channel.
- Aggregating those flowpaths into a representative rectangular WEPP hillslope with a width, a length, and a slope profile.
- Tracing channels to define channel length, routing direction, and slope from flow-vector slopes.
- Estimating channel width using the Bieger (2015) empirical model when that option is enabled.
In WEPPcloud, watershed abstraction is performed by PERIDOT.
PERIDOT
- PERIDOT is a Rust watershed abstraction toolkit that generates WEPP-ready slope profiles and tabular summaries from TOPAZ and WEPPcloud-WBT outputs.
- Its
abstract_watershedandwbt_abstract_watershedworkflows walk flowpaths within each delineated hillslope, aggregate them into representative slope profiles using weighted slope averaging, and derive rectangular hillslope dimensions for WEPP. - Channels are abstracted separately by tracing the channel network, deriving channel slopes from flow-vector slope grids, and estimating channel widths from drainage area with the Bieger (2015) empirical model when that option is enabled.
Hydrology and Hydraulics
WEPP first executes hydrologic and erosion calculations for each hillslope and channel. The flow and sediment yield from each hillslope are fed into associated channels and routed through the channel network to the watershed outlet.
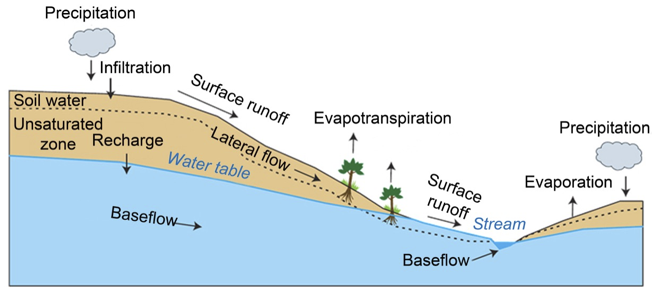
Figure 1. Hydrologic cycle processes represented in WEPP.
Extended figure descriptions for Figures 1 and 2 are provided in the Extended Figure Descriptions section at the end of this page.
- WEPP simulates surface hydrology and hydraulics, subsurface hydrology, vegetation growth and residue decomposition, and sediment detachment and transport along each hillslope and channel segment using four major input files: climate, slope, soil, and vegetation.
- Climate:
- Requires precipitation amount and its characteristics (duration, peak intensity, and time-to-peak intensity).
- Other variables include maximum and minimum temperatures, dew point temperature, solar radiation, wind speed, and wind direction.
- Winter hydrology:
- Snow accumulation, snowmelt, frost, and thaw.
- These processes are performed internally by the model on an hourly basis.
- In current WEPP-Forest builds used by WEPPcloud, frost/thaw execution is
gated by soil
ksflag(0suppresses,1allows).
- Surface hydrology:
- Calculates infiltration, rainfall excess, depression storage, and peak discharge.
- Rainfall excess is calculated at 1-minute intervals following the modified Green-Ampt-Mein-Larson equation.
- Hydraulics:
- Overland flow and peak discharge are computed using a modified kinematic wave equation.
- Percolation:
- Uses storage routing techniques to predict flow through soil layers.
- Plant growth:
- Follows EPIC’s model approach for vegetation growth.
- The model estimates biomass accumulation based on heat units and photosynthetically active radiation.
- Plant growth accounts for water and temperature stress.
- Variables include growing degree days, vegetative dry matter, canopy cover and height, root growth, and leaf area index.
- Evapotranspiration:
- Uses the Penman equation for potential evapotranspiration.
- Another available method is FAO 56 Penman-Monteith.
- Subsurface flow:
- Subsurface lateral flow from hillslopes is estimated using Darcy’s law.
- WEPP maintains a continuous daily water balance of surface runoff, subsurface lateral flow, soil evaporation, plant transpiration, residue evaporation, total soil water, deep percolation, snow accumulation and melt, and frost and thaw.
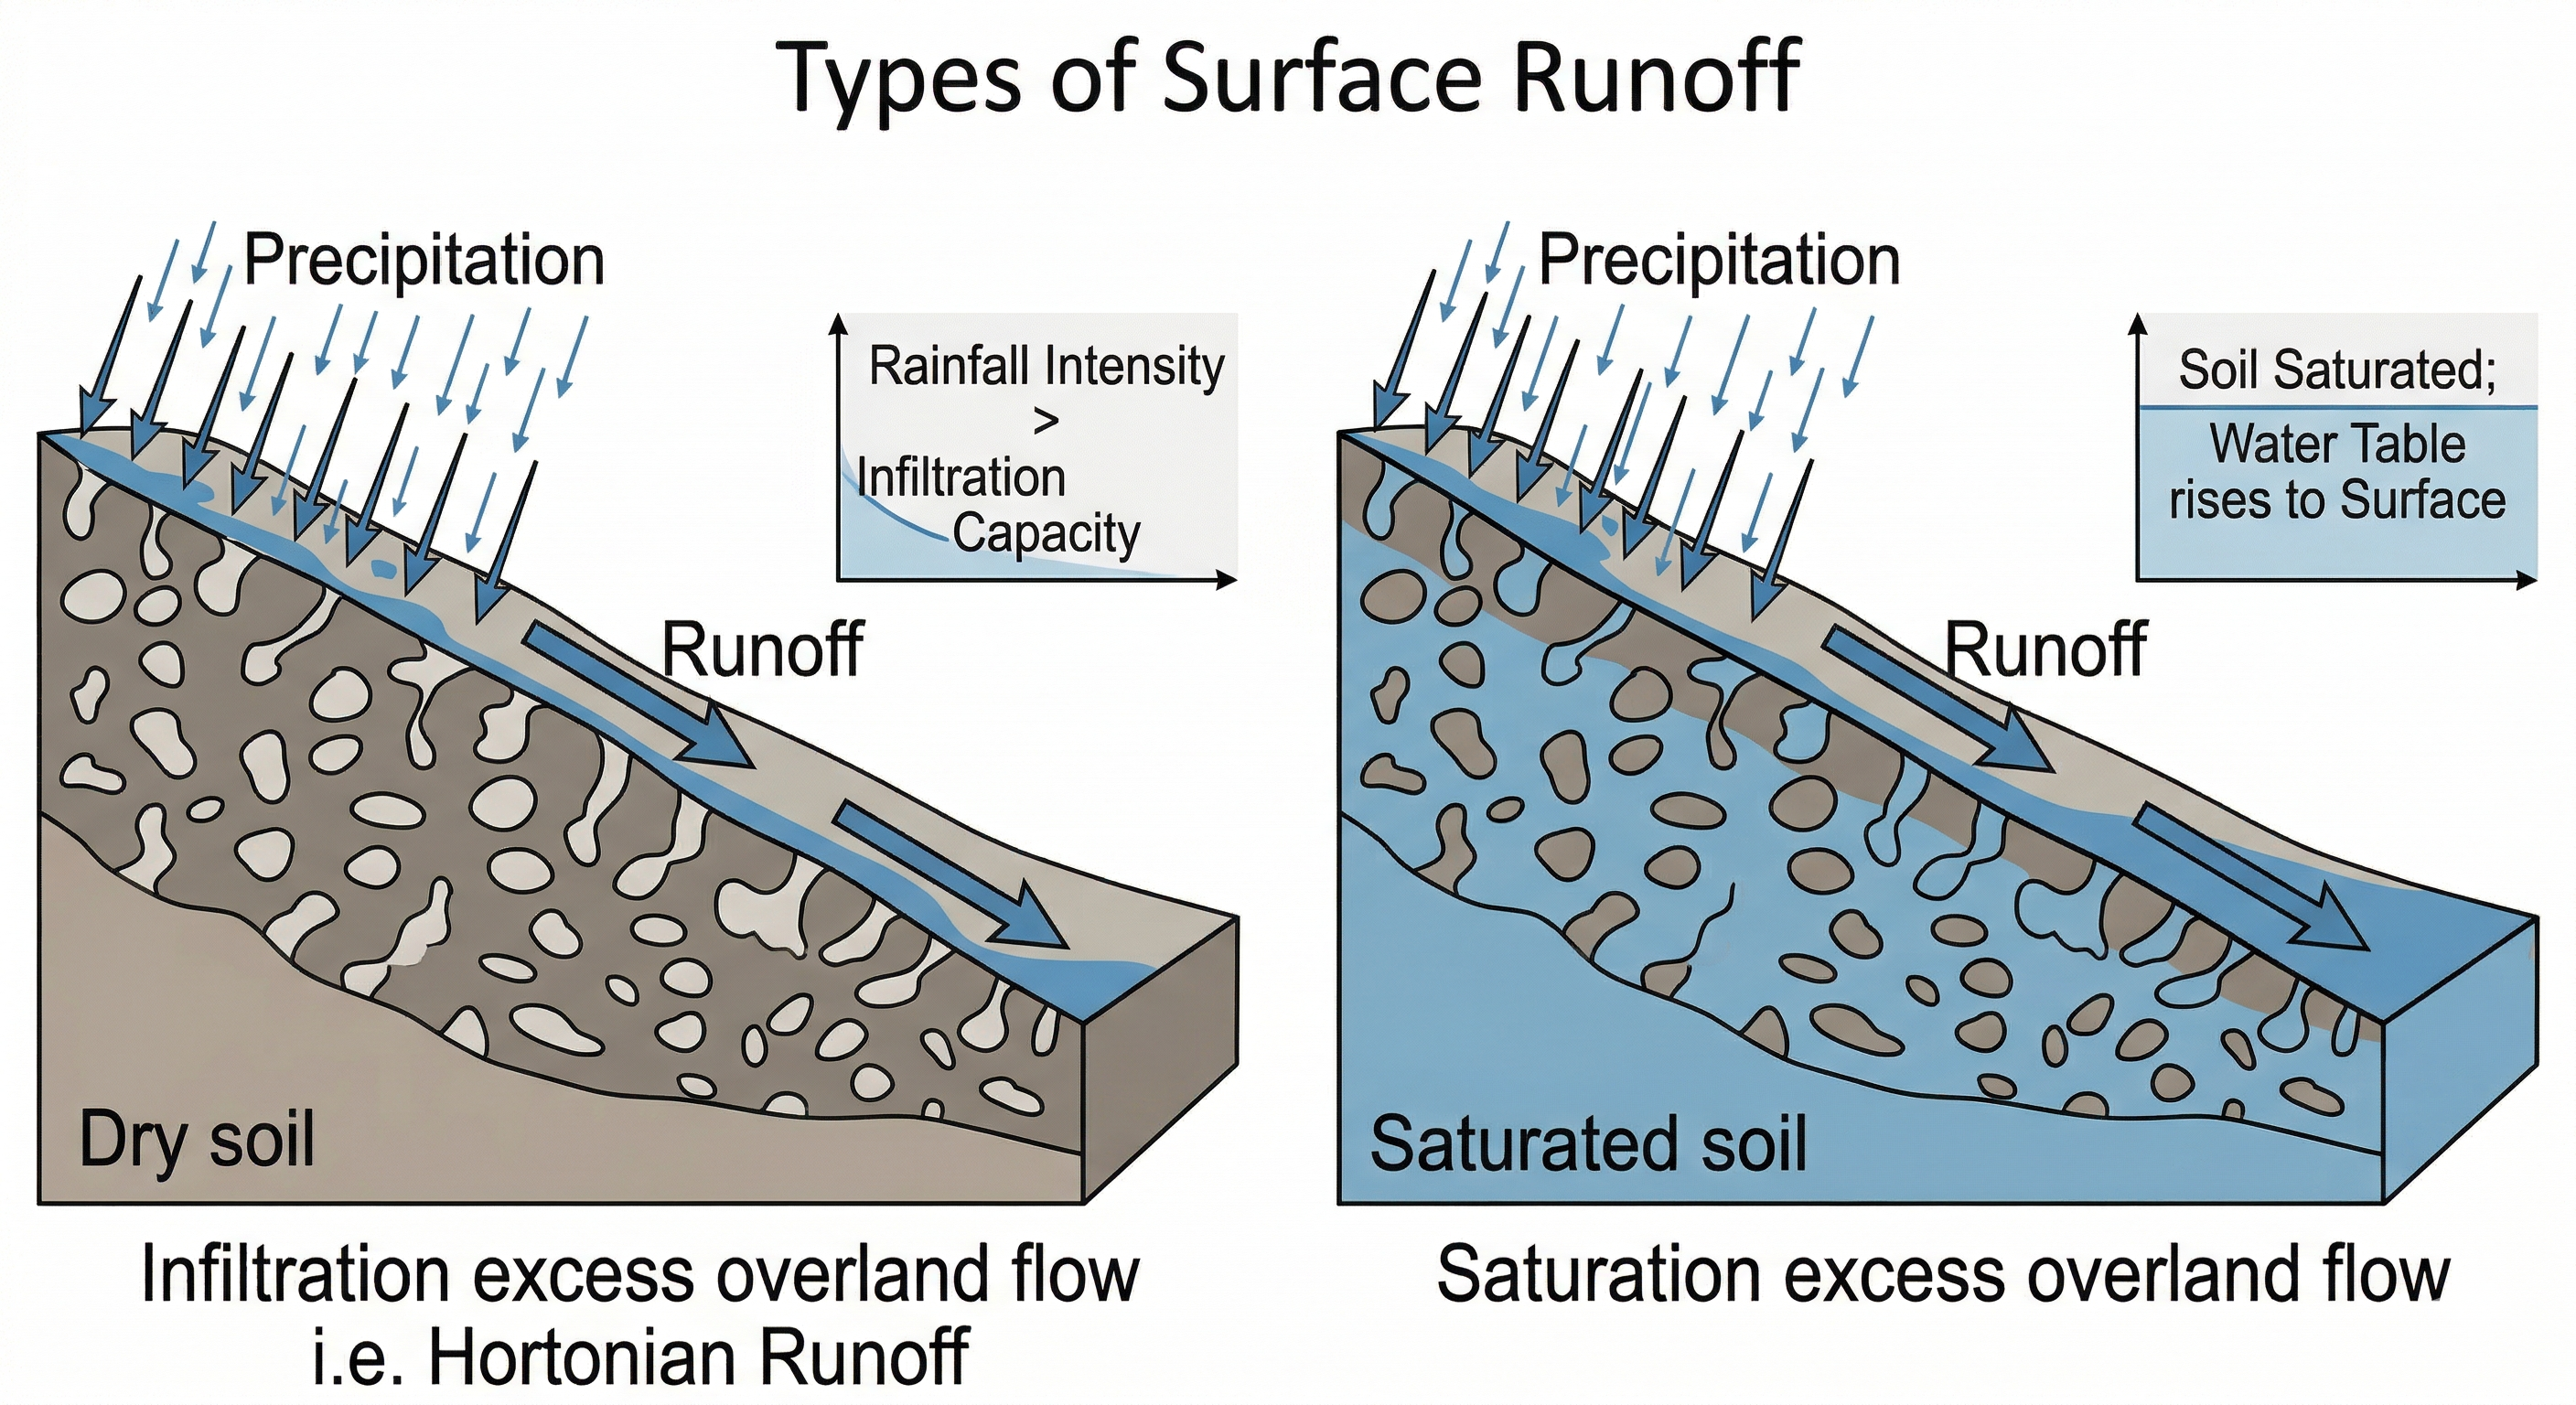
Figure 2. Types of surface runoff relevant to WEPP infiltration and saturation processes.
WEPP models two surface-runoff mechanisms: infiltration-excess overland flow and saturation-excess overland flow. Infiltration-excess runoff occurs when rainfall intensity exceeds the soil's ability to absorb water at the surface, while saturation-excess runoff occurs when the soil profile is already full and cannot store additional water.
- Infiltration-excess (Hortonian) runoff:
- Runoff is generated in an unsaturated soil profile when rainfall intensity exceeds the infiltration capacity of the soil.
- This behavior is commonly associated with parking lots, arid locations during intense rainfall, water-repellent soils, frozen soils, and crusted soils.
- The surface infiltration rate is limited by the hydraulic conductivity of the near-surface layer.
- This type of runoff occurs only while rainfall is occurring.
- Saturation-excess runoff:
- Runoff occurs because the soil is saturated and cannot store any additional water.
- Because it is controlled by antecedent wetness and storage limits, this type of runoff can be present even on a sunny day.
Hillslope Erosion
- WEPP-simulated soil erosion on a hillslope profile is represented in two ways:
- detachment and delivery of soil particles by raindrop impact and shallow sheet flow on interrill areas
- soil particle detachment, transport, and deposition by concentrated flow in rill areas
- Rill erosion is modeled as a function of the flow’s capacity to detach and transport soil versus the existing sediment load in the flow.
- WEPP uses a steady-state sediment continuity equation for erosion computations.
- Soil detachment in rills occurs when:
- the flow hydraulic shear stress exceeds the critical shear stress of the soil
- sediment load is less than sediment transport capacity
- Deposition occurs when sediment load in rill flow is greater than flow sediment transport capacity.
- Sediment transport capacity is calculated using a modified Yalin equation.
Channel Hydrology and Erosion
- Peak runoff rates are computed using:
- modified EPIC
- CREAMS
- Kinematic Wave
- Muskingum-Cunge
- Muskingum-Cunge (variable)
- The last three routing methods support simulations of perennial channels/streams.
- The channel erosion routine in WEPP is similar to rill erosion simulation on hillslopes, except that:
- flow shear stress is calculated using regression equations that approximate spatially varied flow equations
- only entrainment, transport, and deposition by concentrated flow are considered
- Detachment is assumed to occur from the channel bottom until the nonerodible layer is reached, after which the channel starts to widen and the erosion rate decreases with time until flow is too shallow to cause detachment.
Recent Developments
- An improved algorithm for frost simulation based on energy balance (Dun et al., 2010).
- An enhanced algorithm for percolation and subsurface lateral flow, allowing saturation-excess runoff (Dun et al., 2009; Boll et al., 2015).
- A FAO 56 Penman-Monteith method for reference and actual evapotranspiration (ET) developed by Allen et al. (1998) (Wu and Dun, 2004).
- Implementation of more appropriate channel routing methods (for example kinematic wave and Muskingum-Cunge) for perennial streams (Wang et al., 2014).
- A linear reservoir groundwater baseflow contribution from hillslopes to channel streamflow (Srivastava et al., 2017).
Extended Figure Descriptions
Figure 1
A scientific diagram illustrating hydrologic flow and transfer processes on a stylized cross-section of a sloped landscape that runs from an upland area on the left to a valley with a stream on the right.
- Landscape and subsurface structure:
Topsoil layer: A light brown soil layer is at the surface. Within this layer, a horizontal dotted line marks the lower boundary of theSoil waterzone.Unsaturated zone: Below theSoil waterboundary is a thick light brown layer labeledUnsaturated zone, representing a porous zone that contains both air and water.Saturated zone and water table: Below the unsaturated zone is a large light blue area representing the saturated zone. A curving blue line labeledWater tableseparates the two subsurface zones, follows the contour of the landscape, and connects to the stream.Stream: At the valley floor, a small body of water is labeledStream.
- Water input and output processes:
Precipitationon the left: A cloud icon sits above the upland area with a downward arrow labeledPrecipitation. Below it, an arrow labeledInfiltrationpoints from the surface into the topsoil.Precipitationon the right: A second cloud icon and downward arrow labeledPrecipitationshow rainfall over the right side of the landscape.Evapotranspiration: On the right-hand slope near the valley, two tree-like plants have upward arrows labeledEvapotranspiration, showing water loss from plants and soil to the atmosphere.Evaporation: On the right-hand upland area, an upward arrow labeledEvaporationshows direct water loss from the soil surface to the atmosphere.
- Subsurface flow and transfer processes:
Recharge: Within the unsaturated zone, a downward arrow labeledRechargeshows water moving downward toward theWater table.Lateral flow: Within the unsaturated zone, a dotted right-pointing arrow labeledLateral flowshows downslope subsurface movement above the water table.Baseflowin the saturated zone: Within the light blue saturated zone, a long right-pointing arrow labeledBaseflowshows groundwater flow through the saturated material.Baseflowinto the stream: Near the valley floor, a second arrow labeledBaseflowpoints from the water table into the stream bed, showing groundwater discharge to the stream.
- Surface water flow:
Surface runoffon the main hillslope: Above the ground surface on the main slope, a right-pointing arrow labeledSurface runoffshows overland flow moving downslope.Surface runoffinto the stream: On the opposite side of the stream, a shorter right-pointing arrow labeledSurface runoffpoints directly into the stream.Stream convergence: TheStreamis shown as the destination for both surface runoff and baseflow, and its water surface is continuous with the water table.
Figure 2
This diagram, titled "Types of Surface Runoff," compares two side-by-side cross-sections of a sloped soil landscape and shows two different runoff mechanisms.
- Left panel: Infiltration excess overland flow, also called Hortonian runoff.
- The soil is labeled
Dry soiland is drawn with large pores that are not filled with water. - Blue arrows labeled
Precipitationfall onto the hillslope. - A thin blue layer labeled
Runoffmoves downslope across the surface. - An inset chart shows the condition
Rainfall Intensity > Infiltration Capacity, indicating that runoff occurs because rainfall arrives faster than the dry soil can absorb it.
- The soil is labeled
- Right panel: Saturation excess overland flow.
- The soil is labeled
Saturated soiland is filled with blue water, indicating that the pores are already full. - Blue arrows labeled
Precipitationfall onto the hillslope. - A thicker layer labeled
Runoffmoves downslope across the surface. - An inset chart states
Soil Saturated; Water Table rises to Surface, indicating that runoff occurs because the soil cannot store any additional water.
- The soil is labeled